Typesense Prometheus Exporter
Docs menu
A small, fast Prometheus exporter for Typesense, written in Rust. It turns Typesense's health, raft cluster state, request latency, cache and system stats into Prometheus metrics, and ships with Grafana dashboards, alert rules and a one-command demo cluster. It works for a single node and for highly available clusters.






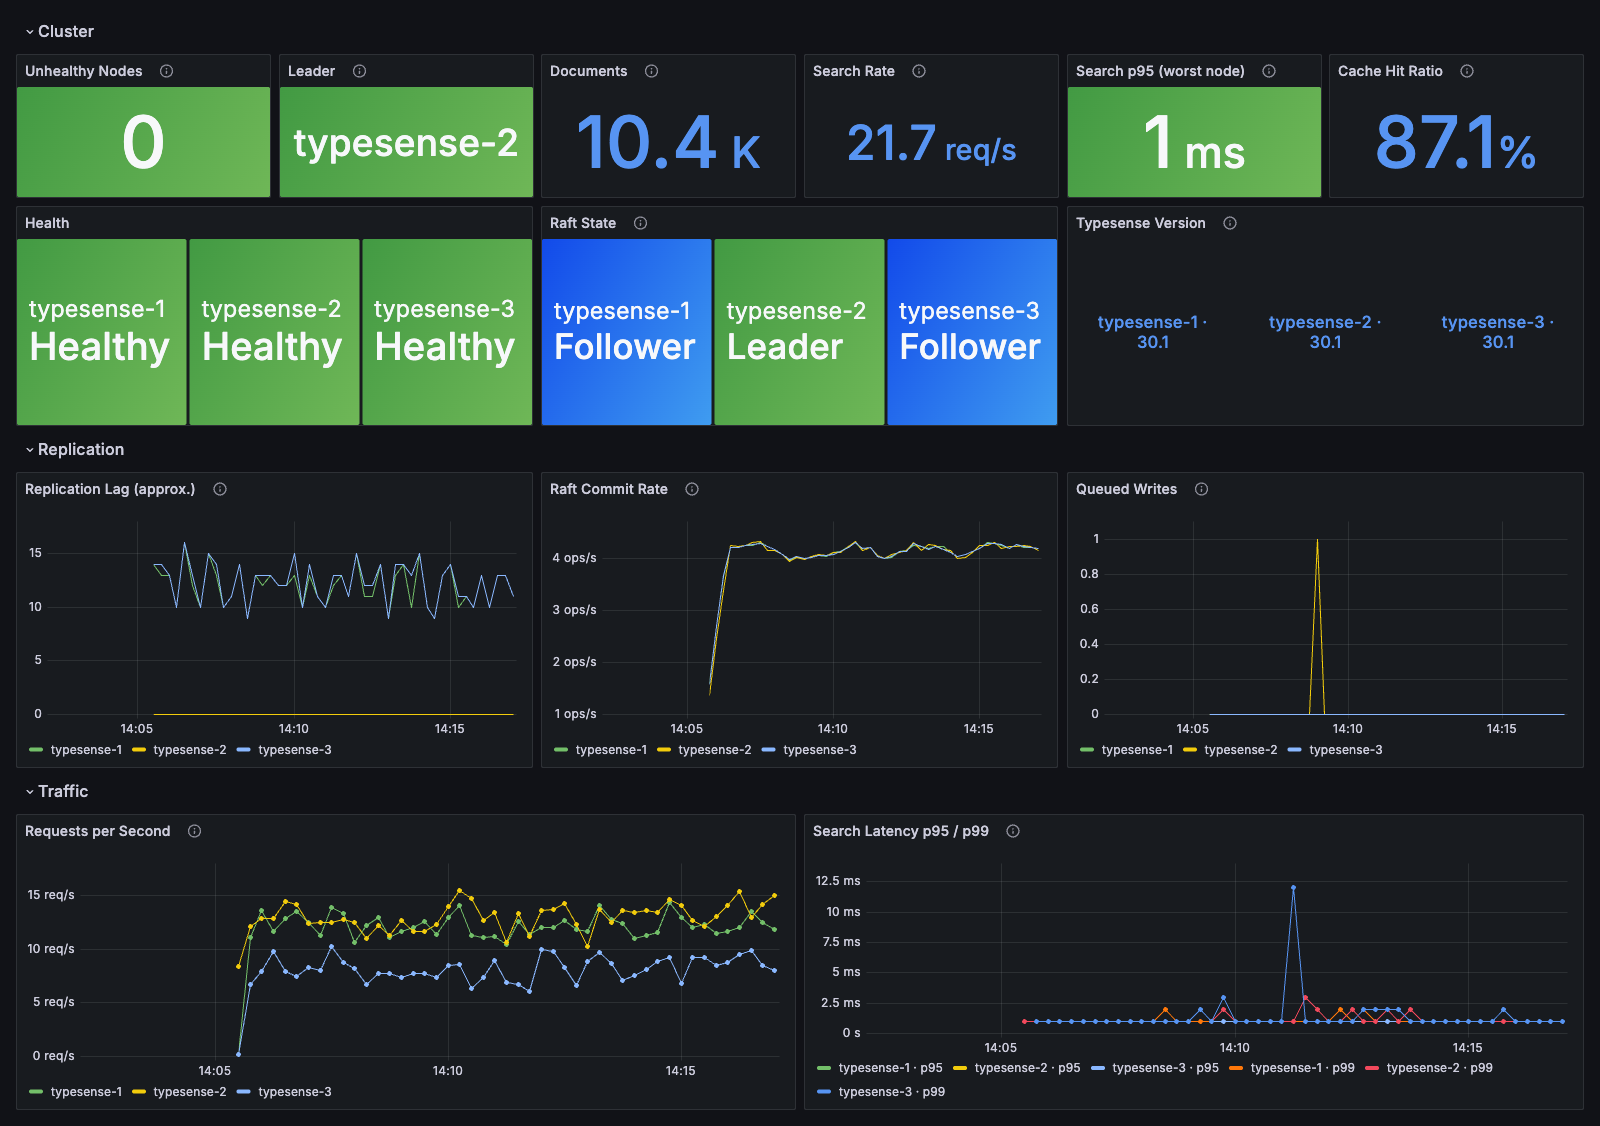
Documentation#
Important: Upgrading from 0.4.x? 1.0.0 renames the metrics. The new 1.0 names are the default, so dashboards and queries built on
typesense_metrics{key=…}ortypesense_stats{key=…}need updating. SetTYPESENSE_METRIC_NAMES=bothto keep the old names alongside the new ones while you migrate. See migrating to 1.0.
Features#
| 🩺 Health and cluster state | typesense_health and typesense_raft_state per node. Alert on an unhealthy node, or on a cluster that has lost its leader. |
| 📊 System and memory | CPU for every core, disk, memory, swap, network, and Typesense's allocator memory. |
| ⚡ Request stats | Requests per second, and latency in seconds for search, write, import and delete: average, p70, p95, p99, min and max. Broken down per endpoint and per collection, plus cache hits and misses and pending write batches. |
| 🔁 Replication and collections | Raft committed index and queued writes per node, so you can see replication lag. Document count per collection. Typesense version per node. |
| 🎯 Honest failures | If Typesense can't be reached, its metrics are left out, never faked as zeros. A per-request timeout keeps a hung node from stalling scrapes. |
| 📦 Tiny image | A static binary in a FROM scratch image, for linux/amd64 and linux/arm64. |
| 🧰 Batteries included | 4 Grafana dashboards, Prometheus alert rules, and a one-command Docker Compose cluster for trying it all out. |
Quick start#
See it working in one command. This starts a 3-node Typesense cluster, one exporter probing all three, and Prometheus and Grafana:
docker compose up -d --build
./scripts/traffic.sh 300          # optional: generate traffic
open http://localhost:3000        # Grafana: admin / admin
Monitor your own Typesense. Run an exporter next to a node:
docker run -d -p 8888:8888 \
  -e TYPESENSE_HOST=typesense-1.internal \
  -e TYPESENSE_API_KEY=<admin-api-key> \
  imatefx/typesense-prometheus-exporter:v1.4.0

curl -s localhost:8888/metrics | grep -E '^typesense_(health|raft_state)'
Then scrape it from Prometheus. The exporter serves /metrics, the Prometheus default, so a single node needs only its address:
scrape_configs:
  - job_name: typesense-exporter
    scrape_timeout: 10s   # must be above TYPESENSE_TIMEOUT (5s by default)
    static_configs:
      - targets: [exporter-1.internal:8888]
For a cluster with one exporter next to each node, list every exporter:
scrape_configs:
  - job_name: typesense-exporter
    scrape_timeout: 10s
    static_configs:
      - targets:
          - exporter-1.internal:8888   # exporter for typesense-1
          - exporter-2.internal:8888   # exporter for typesense-2
          - exporter-3.internal:8888   # exporter for typesense-3
One exporter for a whole cluster. Leave out TYPESENSE_HOST, list the nodes the exporter may probe, and let Prometheus pass each node as a target, like blackbox_exporter:
docker run -d -p 8888:8888 \
  -e TYPESENSE_PROBE_ALLOWED_TARGETS=ts-1.internal,ts-2.internal,ts-3.internal \
  -e TYPESENSE_API_KEY=<admin-api-key> \
  imatefx/typesense-prometheus-exporter:v1.4.0

curl -s 'localhost:8888/probe?target=ts-1.internal' | grep -E '^typesense_(health|raft_state)'
Prometheus scrapes the exporter once per node and passes the node as target. Spelled out, each node is one entry: the address is the exporter, __param_target becomes ?target=, and instance names the node:
scrape_configs:
  - job_name: typesense-exporter
    metrics_path: /probe
    static_configs:
      - targets: [exporter.internal:8888]   # the exporter
        labels: {__param_target: ts-1.internal:8108, instance: ts-1.internal:8108}
      - targets: [exporter.internal:8888]
        labels: {__param_target: ts-2.internal:8108, instance: ts-2.internal:8108}
      - targets: [exporter.internal:8888]
        labels: {__param_target: ts-3.internal:8108, instance: ts-3.internal:8108}
The same scrape config, shorter as the cluster grows: list only the nodes, and let relabeling fill in the rest. This is the usual blackbox_exporter pattern, and it also works with service discovery instead of static_configs:
scrape_configs:
  - job_name: typesense-exporter
    metrics_path: /probe
    static_configs:
      - targets: [ts-1.internal:8108, ts-2.internal:8108, ts-3.internal:8108]
    relabel_configs:
      - source_labels: [__address__]    # the node...
        target_label: __param_target    # ...becomes ?target=<node>
      - source_labels: [__param_target]
        target_label: instance          # instance names the node, not the exporter
      - target_label: __address__
        replacement: exporter.internal:8888   # every scrape goes to the exporter
Several clusters with different keys. Put everything in one TOML file, with a [clusters.<name>] per cluster (targets, api_key_file or api_key_env, optional protocol), and start with typesense-prometheus-exporter --config exporter.toml. /probe uses a cluster's key only for that cluster's nodes. See the config file, several clusters and deploy/exporter.example.toml.
The exporter only probes the listed nodes, because it sends its API key to every node it scrapes. See configuration.
On Kubernetes, deploy/kubernetes/ has plain manifests (with a Prometheus Operator ServiceMonitor or Probe) for both setups, and a key file such as a mounted Secret is reloaded without a restart.
The exporter's own health. GET /exporter/metrics serves counters for scrapes (including refused /probe targets), Typesense request outcomes and durations, probe slot waits and API key reloads, apart from any node's output. Scrape it as its own job (metrics_path: /exporter/metrics, no /probe); see exporter metrics and the job in deploy/prometheus/prometheus.yml.
Then import the dashboards and alert rules. The getting started guide walks through it.
Configuration#
| Flag | Environment variable | Default |
|---|---|---|
--config |
TYPESENSE_EXPORTER_CONFIG |
(none): TOML file that can set every option below and define per-cluster API keys; see configuration |
--typesense-host |
TYPESENSE_HOST |
(required unless --probe-allowed-targets or config clusters are set) |
--typesense-api-key / --typesense-api-key-file |
TYPESENSE_API_KEY / TYPESENSE_API_KEY_FILE |
(one is required) |
--typesense-port |
TYPESENSE_PORT |
8108 |
--typesense-protocol |
TYPESENSE_PROTOCOL |
http |
--typesense-timeout |
TYPESENSE_TIMEOUT |
5 seconds (0 disables); keep it below Prometheus' scrape_timeout |
--exporter-bind-address |
EXPORTER_BIND_ADDRESS |
0.0.0.0 |
--exporter-bind-port |
EXPORTER_BIND_PORT |
8888 |
--metric-names |
TYPESENSE_METRIC_NAMES |
v1 (both or legacy keep the 0.4 names; see migrating) |
--probe-allowed-targets |
TYPESENSE_PROBE_ALLOWED_TARGETS |
(empty): comma-separated host[:port] nodes /probe?target= may scrape, or * for any |
--probe-max-concurrency |
TYPESENSE_PROBE_MAX_CONCURRENCY |
16: most /probe scrapes running at once; more wait for a slot |
--log-level |
TYPESENSE_EXPORTER_LOG_LEVEL |
info (error, warn, info, debug, trace); debug logs every Typesense request, and RUST_LOG overrides it; see logging |
--log-format |
TYPESENSE_EXPORTER_LOG_FORMAT |
text (or json, one object per line) |
See configuration for API key permissions, timeouts, failure behaviour, Prometheus and Grafana setup.
Metrics at a glance#
| Metric | What it tells you |
|---|---|
typesense_health |
1 healthy, 0 unhealthy or unreachable |
typesense_raft_state |
1 leader, 4 follower, 0 other or unreachable |
typesense_raft_committed_index |
Raft log position; compare across nodes for replication lag |
typesense_raft_queued_writes |
Writes waiting to be applied |
typesense_collection_documents{collection=…} |
Documents per collection |
typesense_info{version=…} |
Typesense version of each node |
typesense_scrape_success{endpoint=…} |
Whether each Typesense endpoint could be read, for spotting key or version problems |
typesense_system_* |
CPU (…_cpu_active_ratio, per core …_cpu_core_active_ratio{core}), memory, swap and disk in bytes, network byte counters (…_bytes_total) |
typesense_process_memory_* |
Typesense's allocator memory in bytes, and its fragmentation ratio |
typesense_requests_per_second{operation=…} |
Requests per second for search, import, write and delete; plus typesense_all_requests_per_second and typesense_overloaded_requests_per_second |
typesense_request_latency_seconds{operation=…,quantile=…} |
Latency min (0), p70, p95, p99 and max (1); the average is typesense_request_latency_avg_seconds |
typesense_cache_hit_ratio, typesense_cache_hits, typesense_cache_misses |
Search cache; plus typesense_pending_write_batches |
typesense_route_{latency_seconds,requests_per_second}{route=…}, typesense_collection_{latency_seconds,requests_per_second}{collection=…,action=…} |
Requests per second and latency per API route, and per collection and action |
typesense_unmapped{source=…,key=…} |
Numeric Typesense fields the exporter has no name for yet (raw values) |
See the metrics reference for every family, with units and example PromQL. These are the 1.0 names, the default since 1.0.0; the 0.4 names map over as shown in the migration guide.
Alerts#
| Alert | Fires when |
|---|---|
TypesenseExporterDown |
Prometheus can't scrape an exporter (or, with /probe, a probe through it) for 1m |
TypesenseUnhealthy |
A node is unhealthy or unreachable for 1m |
TypesenseNoLeader |
No node is raft leader for 1m. A normal election (a few seconds) doesn't trigger it. |
TypesenseScrapeFailing |
A healthy node has an endpoint the exporter can't read for 5m (API key permissions, older Typesense) |
TypesenseExporterKeyReloadFailing |
A rotated API key file can't be read for 5m; the exporter still uses the previous key |
TypesenseExporterProbeRefused |
/probe refused a target (403) in the last 10m: something probes nodes that aren't allowed. Malformed requests (400) are counted but don't alert |
TypesenseExporterProbesSaturated |
Probes wait over 1s (p95) for a --probe-max-concurrency slot for 10m |
TypesenseExporterSelfMetricsDown |
The typesense-exporter-self job can't be scraped for 5m; the three alerts above are silent meanwhile |
The last four need the exporter's own metrics, from the /exporter/metrics scrape job.
Dashboards#
Four Grafana dashboards, each with a Node filter. Import them from grafana.com by ID (Dashboards → New → Import):
| Dashboard | grafana.com ID |
|---|---|
| Typesense Cluster Overview | 26064 |
| Typesense Stats | 26065 |
| Typesense Metrics | 26066 |
| Typesense By Collection | 26067 |
See them all in screenshots, and how to install them in alerts and dashboards.
Development#
make test         # lint + unit + integration tests
make coverage     # coverage report (fails under 90%)
make e2e          # end-to-end tests against a real 3-node cluster (needs Docker)
make up / down    # start / stop the Docker Compose stack
./build-cross.sh  # static linux/amd64 + linux/arm64 binaries
There are 207 tests in three layers. Unit and integration tests run against a mock Typesense. End-to-end tests run against a real cluster and break it on purpose: leader failover, a hung node, quorum loss. They run against Typesense 30.1 and 27.1 (TYPESENSE_VERSION=27.1 make e2e). See testing for the full list, and architecture for how it works.
Contributors#
Thanks to everyone who has contributed:
 Stalin Pereira Creator and maintainer |
 Leandro Stats protocol fix (#4) |
 Andrii Maryskevych Multi-arch Docker (#10), health and raft (#13) |
 weriomat Optional CPU metrics (#11) |
 Sebastian Caldarola Multi-host proposal (#14) |
 cyppe Per-core CPU, swap, cache ratio (#15) |
License#
MIT © Stalin Pereira
This page is generated from README.md on GitHub. Found a mistake? Open an issue.