Docs menu
Everything here ships in the repo: the dashboards are in grafana/ and the rules in
deploy/prometheus/alerts.yml. The bundled Docker Compose stack
provisions both, so docker compose up -d shows them working before you touch your own Prometheus.
Alert rules#
| Alert | Fires when |
|---|---|
TypesenseExporterDown |
Prometheus can't scrape an exporter (or, with /probe, a probe through it) for 1m |
TypesenseUnhealthy |
A node is unhealthy or unreachable for 1m |
TypesenseNoLeader |
No node is raft leader for 1m. A normal election (a few seconds) doesn't trigger it. |
TypesenseScrapeFailing |
A healthy node has an endpoint the exporter can't read for 5m (API key permissions, older Typesense) |
TypesenseExporterKeyReloadFailing |
A rotated API key file can't be read for 5m; the exporter still uses the previous key |
TypesenseExporterProbeRefused |
/probe refused a target (403) in the last 10m: something probes nodes that aren't allowed. Malformed requests (400) are counted but don't alert |
TypesenseExporterProbesSaturated |
Probes wait over 1s (p95) for a --probe-max-concurrency slot for 10m |
TypesenseExporterSelfMetricsDown |
The typesense-exporter-self job can't be scraped for 5m; the three alerts above are silent meanwhile |
The last four need the exporter's own metrics, from the /exporter/metrics scrape job.
To use them, copy alerts.yml next to your Prometheus config and list it under rule_files:
rule_files:
  - alerts.yml
The rules, in full:
groups:
  - name: typesense
    rules:
      - alert: TypesenseExporterDown
        expr: up{job="typesense-exporter"} == 0
        for: 1m
        labels: { severity: critical }
        annotations:
          # `up` is per probe: the exporter answers 200 even when Typesense is
          # down (that is TypesenseUnhealthy), so up == 0 means the exporter
          # itself is unreachable or refused the target. If it is down, all
          # nodes alert at once.
          summary: "Probing {{ $labels.instance }} through the exporter failed: the exporter is down, unreachable, or refuses this target"

      - alert: TypesenseUnhealthy
        expr: typesense_health == 0
        for: 1m
        labels: { severity: critical }
        annotations:
          summary: "Typesense {{ $labels.host }}:{{ $labels.port }} is unhealthy or unreachable"

      - alert: TypesenseNoLeader
        expr: max(typesense_raft_state == bool 1) == 0
        for: 1m
        labels: { severity: critical }
        annotations:
          summary: "No Typesense node reports itself as raft leader"

      # A node is healthy but the exporter can't read one of its endpoints,
      # e.g. the API key lacks an action, or an older Typesense lacks /status.
      - alert: TypesenseScrapeFailing
        expr: typesense_scrape_success{endpoint!="/health"} == 0 unless on (host, port) typesense_health == 0
        for: 5m
        labels: { severity: warning }
        annotations:
          summary: "Exporter can't read {{ $labels.endpoint }} from Typesense {{ $labels.host }}:{{ $labels.port }}"

  # Health of the exporter itself, from its /exporter/metrics endpoint (scrape
  # job typesense-exporter-self in prometheus.yml).
  - name: typesense-exporter
    rules:
      # The three alerts below read the exporter's own metrics, so they are
      # silent when this job is down. If the job is not configured at all there
      # is no `up` series and this alert can't fire either; check that
      # up{job="typesense-exporter-self"} exists.
      - alert: TypesenseExporterSelfMetricsDown
        expr: up{job="typesense-exporter-self"} == 0
        for: 5m
        labels: { severity: warning }
        annotations:
          summary: "Prometheus can't scrape the exporter's own metrics from {{ $labels.instance }}"
          description: "The exporter alerts for key reloads, refused probes and probe saturation read /exporter/metrics and are silent while this job is down. An absent up{job=\"typesense-exporter-self\"} series means the job is not configured; see the typesense-exporter-self job in prometheus.yml."

      # The exporter keeps using the previous key, so scrapes work until the
      # old key is revoked, and then every one of them fails.
      - alert: TypesenseExporterKeyReloadFailing
        expr: max by (instance, key) (typesense_exporter_key_reload_failing) == 1
        for: 5m
        labels: { severity: warning }
        annotations:
          summary: "Exporter {{ $labels.instance }} can't read the rotated API key file for {{ $labels.key }}"
          description: "The latest reload of the {{ $labels.key }} key file failed, so the exporter is still using the previous key. Fix the file (the exporter log says why) before the old key is revoked."

      # for: 0m on purpose. increase() over 10m keeps the alert firing for 10m
      # after the last refusal, and a single refused target is already worth a
      # look, so there is nothing to wait for; `for: 5m` would only delay it.
      # Only refused (403) targets alert. Invalid requests (400: a port scanner,
      # /probe without a target) are counted but anyone who can reach the
      # exporter can cause them, so they would make the alert noisy.
      - alert: TypesenseExporterProbeRefused
        expr: sum by (instance) (increase(typesense_exporter_scrapes_total{handler="probe",result="refused"}[10m])) > 0
        for: 0m
        labels: { severity: warning }
        annotations:
          summary: "Exporter {{ $labels.instance }} refused probes in the last 10m"
          description: "Something is probing targets the exporter doesn't allow (403). Compare the Prometheus scrape config with --probe-allowed-targets and the config file's clusters, or find who else can reach the exporter."

      - alert: TypesenseExporterProbesSaturated
        expr: histogram_quantile(0.95, sum by (instance, le) (rate(typesense_exporter_probe_slot_wait_seconds_bucket[10m]))) > 1
        for: 10m
        labels: { severity: warning }
        annotations:
          summary: "Probes through exporter {{ $labels.instance }} wait over 1s for a slot (p95)"
          description: "More probes arrive than --probe-max-concurrency allows at once, so scrapes queue and may time out. Raise --probe-max-concurrency."
See configuration for how each rule behaves with /probe,
and the metrics reference for more PromQL, such as replication lag.
Grafana dashboards#
The dashboards are on grafana.com. In Grafana, go to Dashboards → New → Import, enter an ID and click Load, then pick your Prometheus data source:
| Dashboard | grafana.com ID |
|---|---|
| Typesense Cluster Overview | 26064 |
| Typesense Stats | 26065 |
| Typesense Metrics | 26066 |
| Typesense By Collection | 26067 |
Without internet access, upload the JSON files from grafana/ instead. Every dashboard has a
Node filter, and they work the same whether you run one exporter per node or one exporter
with /probe, because the host and port labels always name the Typesense node.
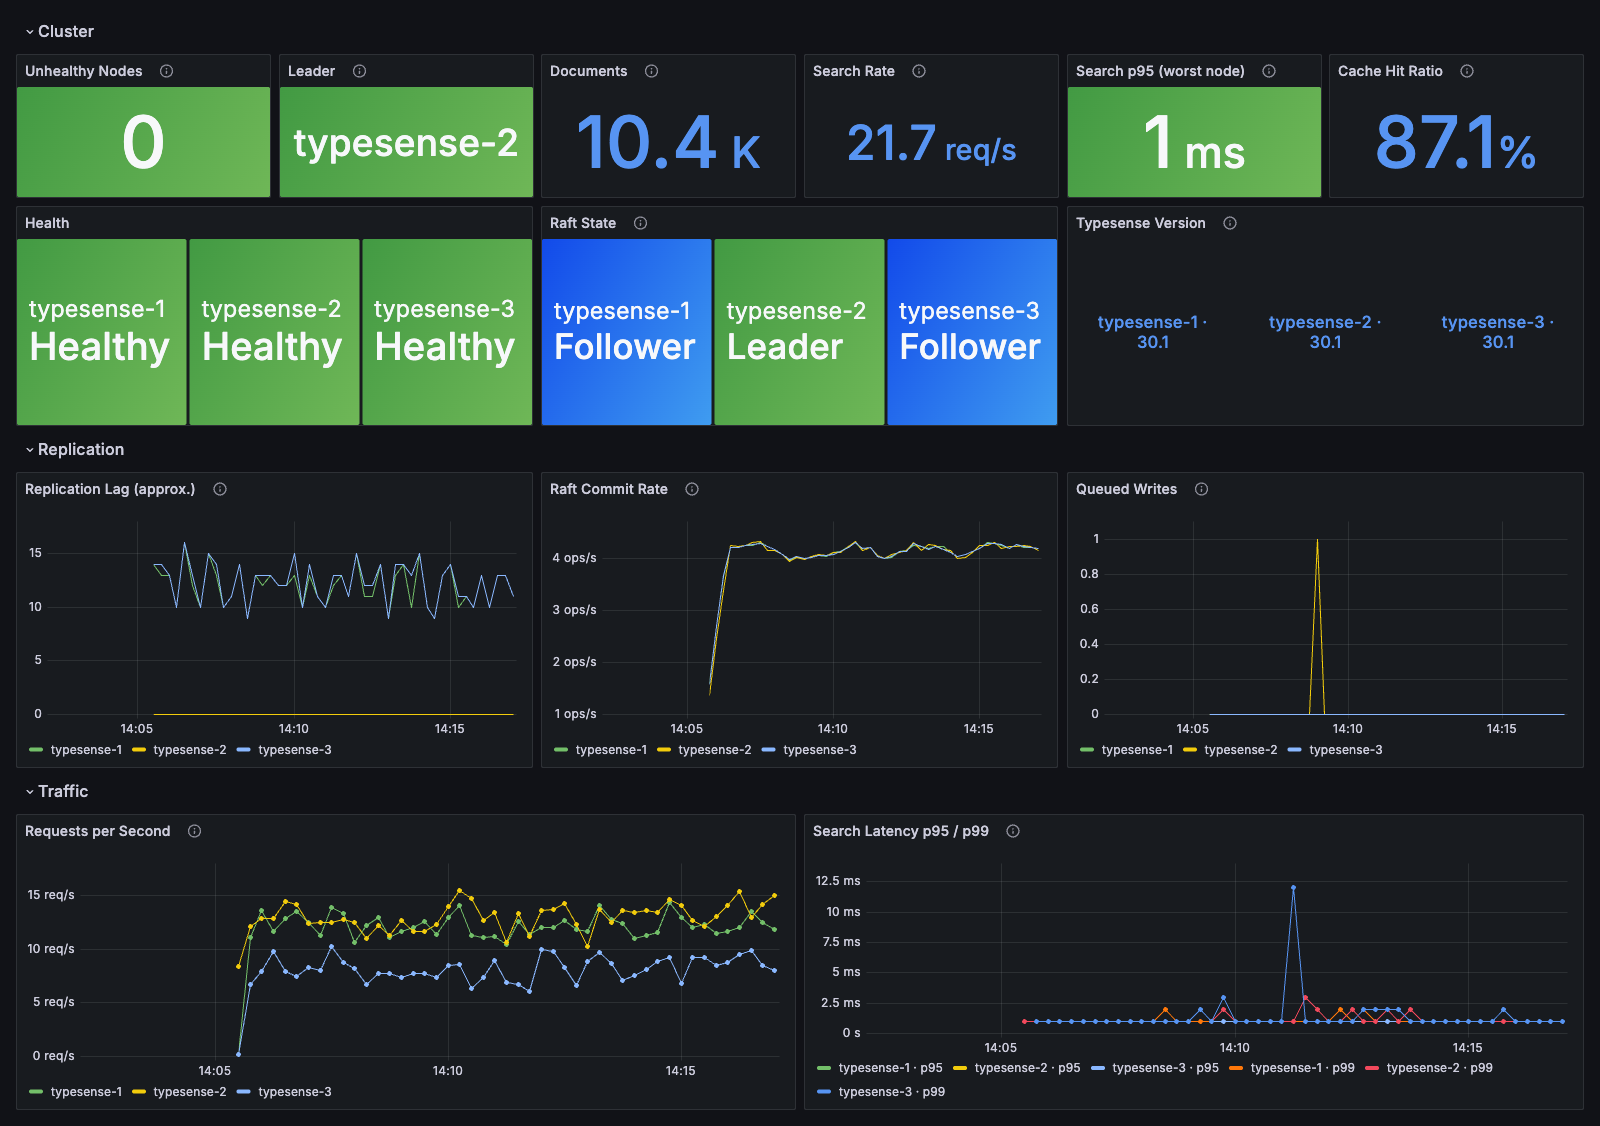
Typesense Cluster Overview#
health, leader, versions, replication lag, documents, headline traffic.
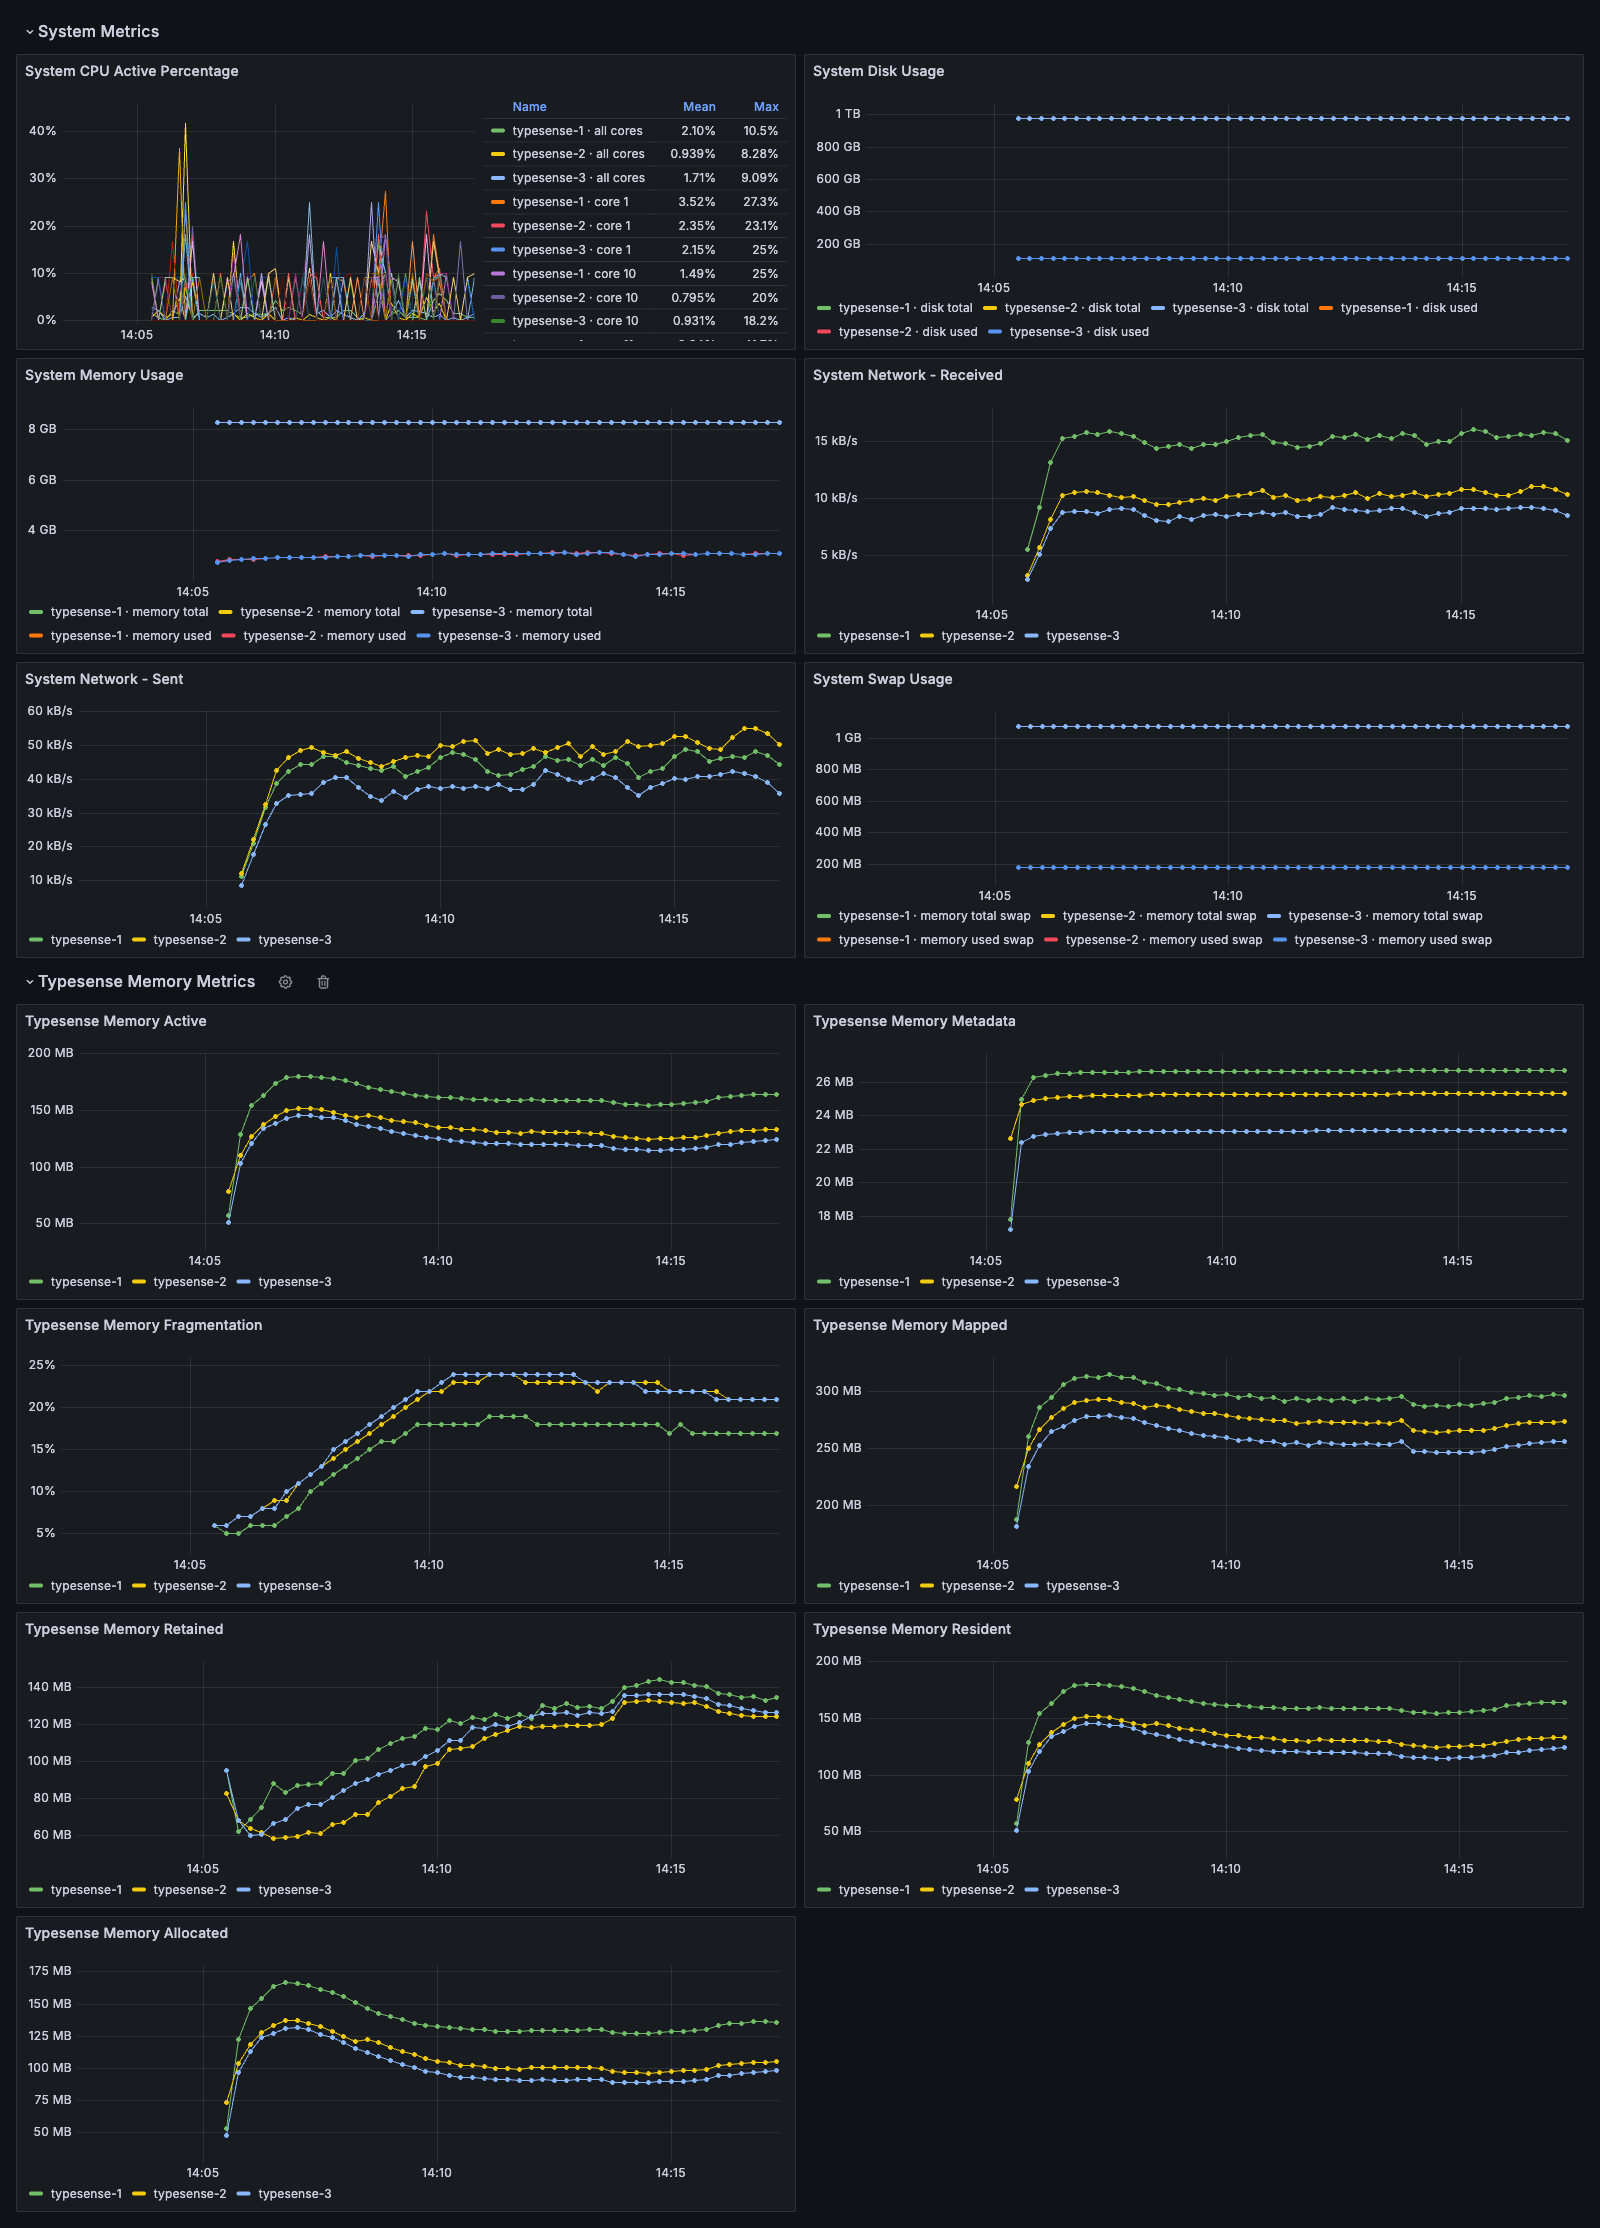
Typesense Metrics#
CPU per core, disk, memory, swap, network, allocator memory.
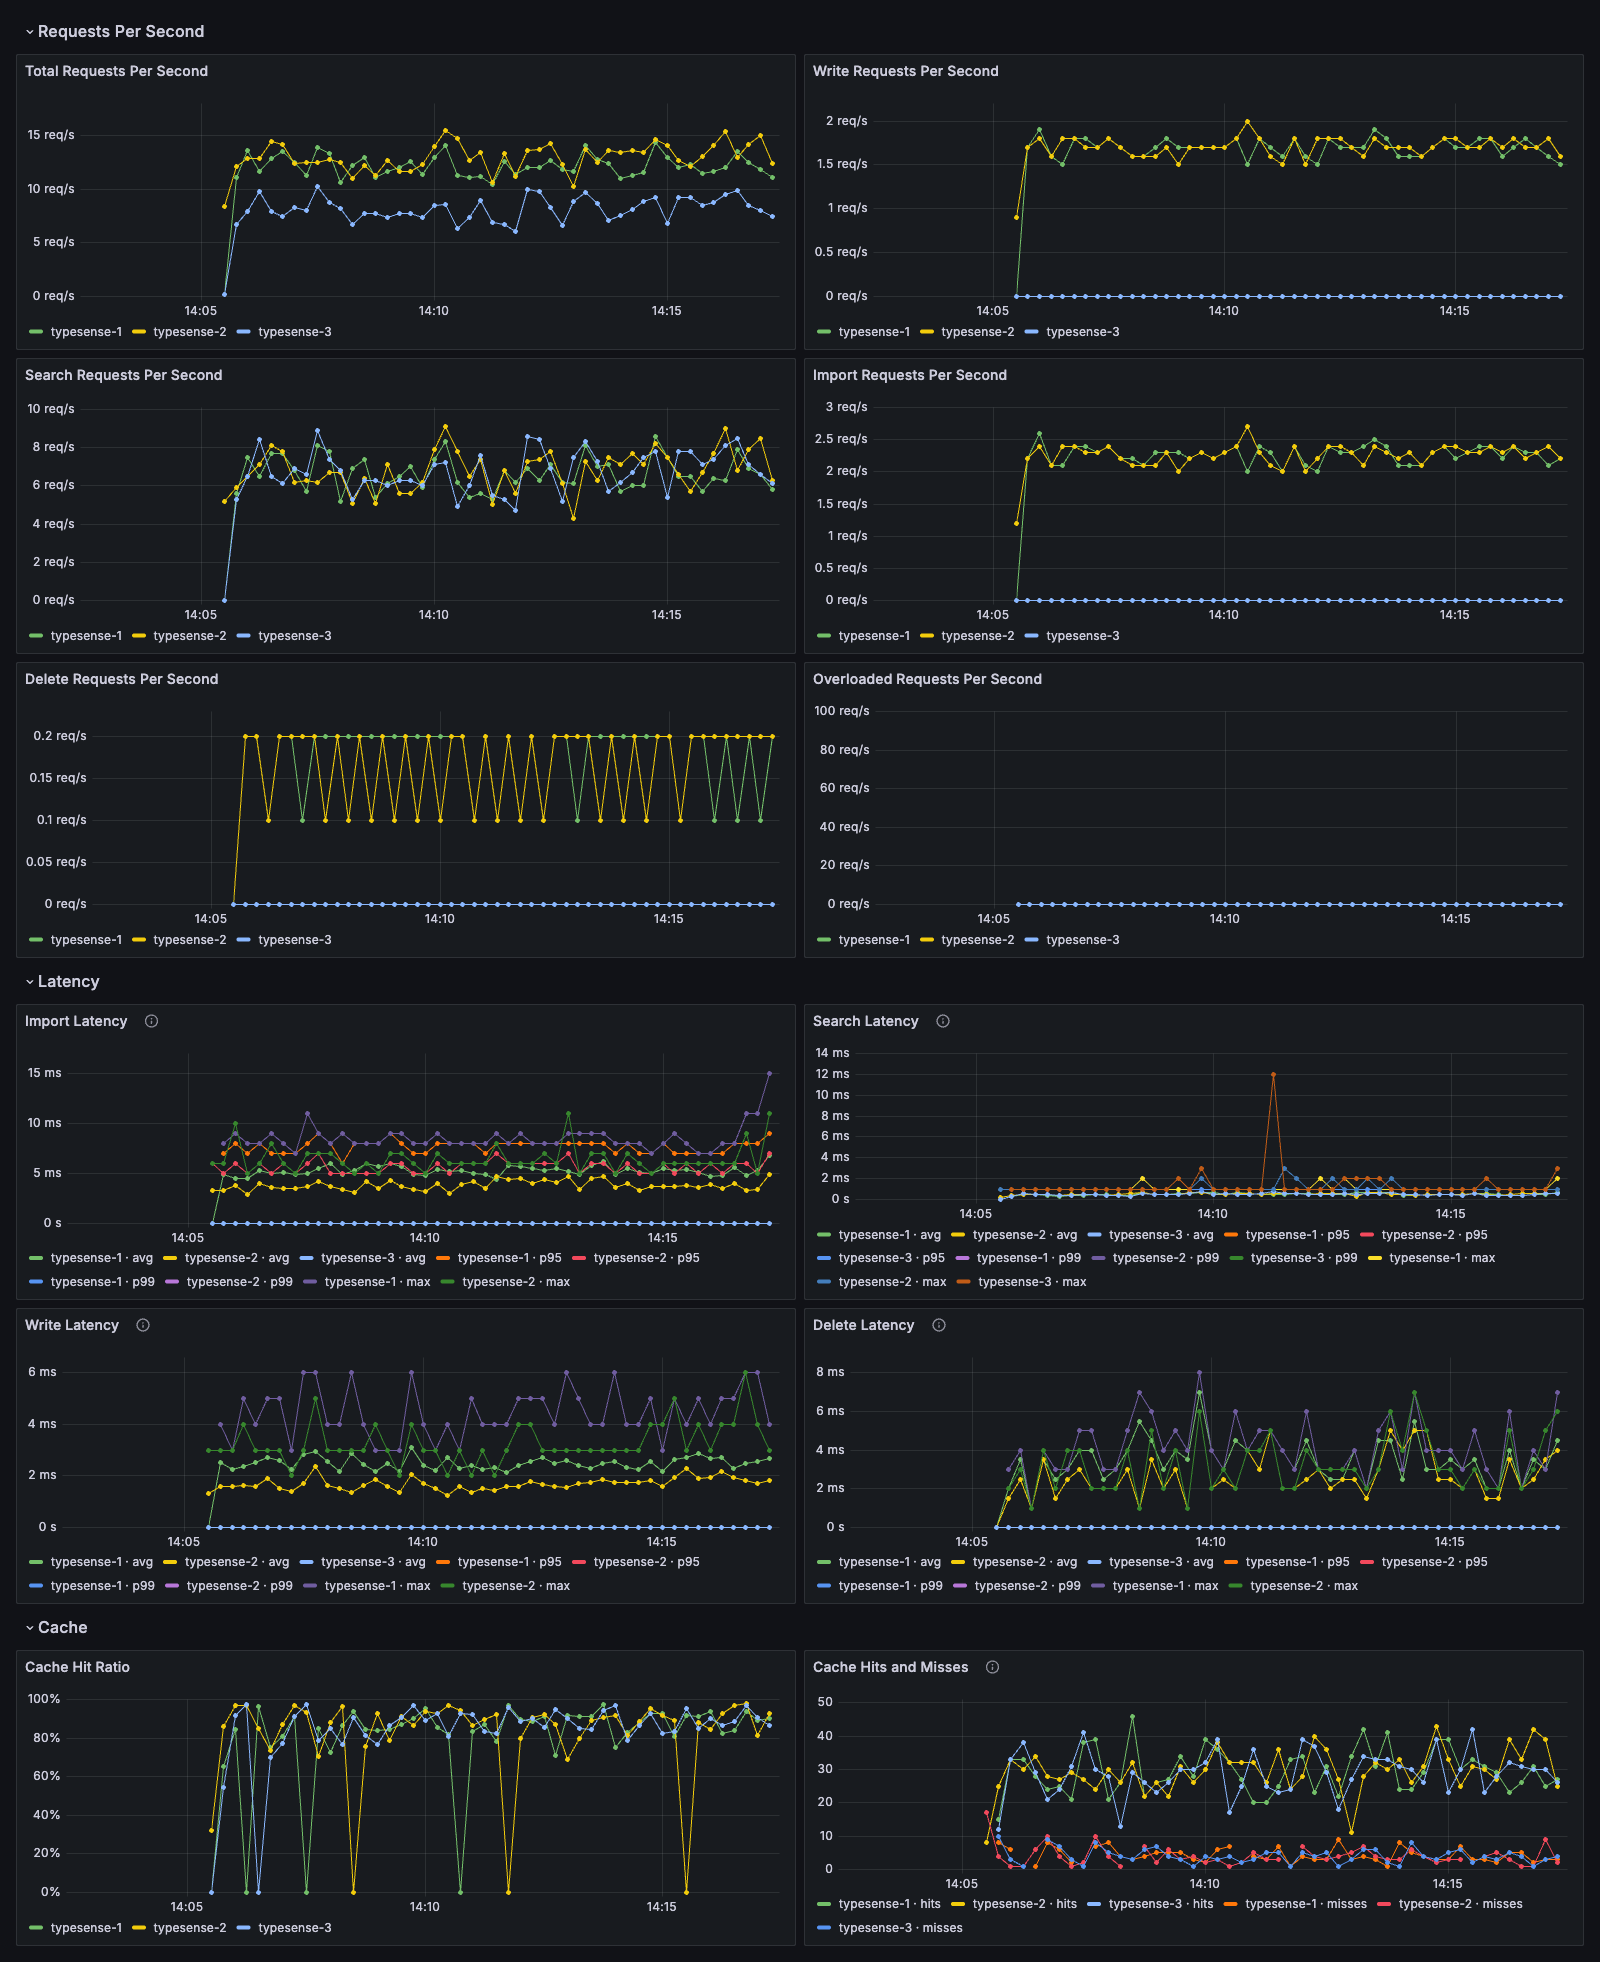
Typesense Stats#
request rates, latency avg/p95/p99/max, cache.
Typesense By Collection#
per-collection request rate, latency and documents.
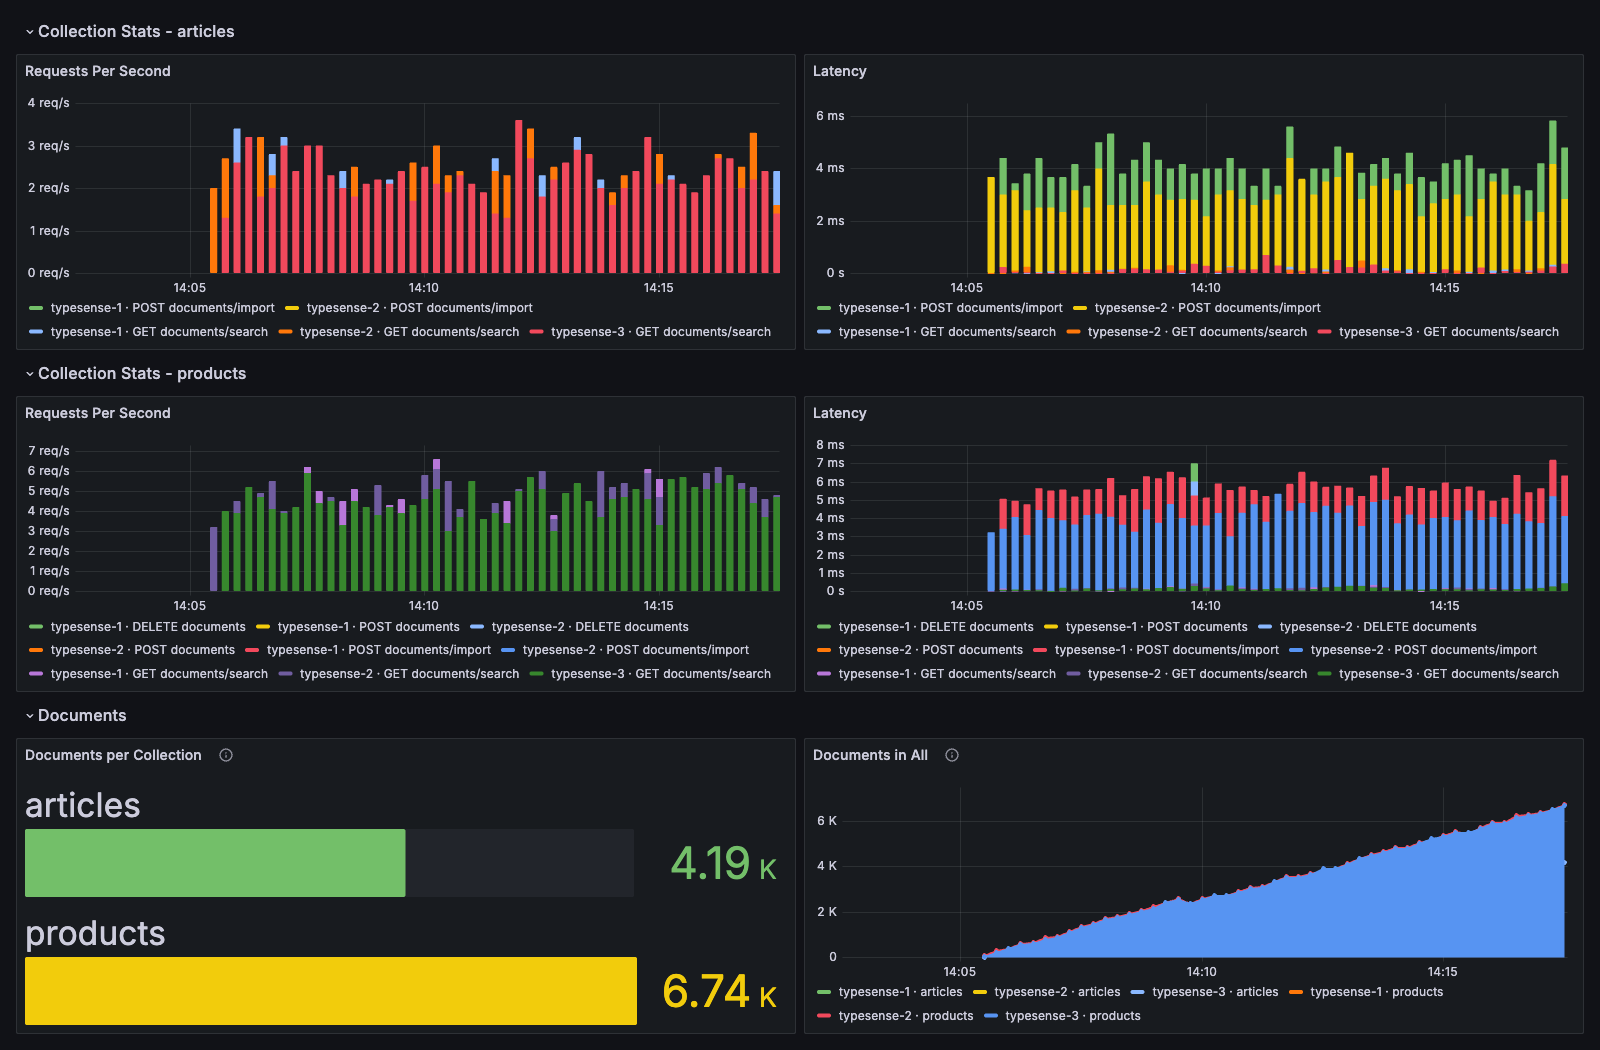
The screenshots were taken from the bundled Docker Compose stack: 3 nodes under generated traffic.
This page is generated from README.md on GitHub. Found a mistake? Open an issue.