Docs menu
The four dashboards that ship with the exporter, captured from the bundled Docker Compose stack: a 3-node Typesense cluster under generated traffic. Each has a Node filter. Click a screenshot for the full-size image.
Typesense Cluster Overview#
The one to keep open. Is every node healthy, who is the raft leader, are all nodes on the same version, is replication keeping up, and how much traffic is the cluster serving.
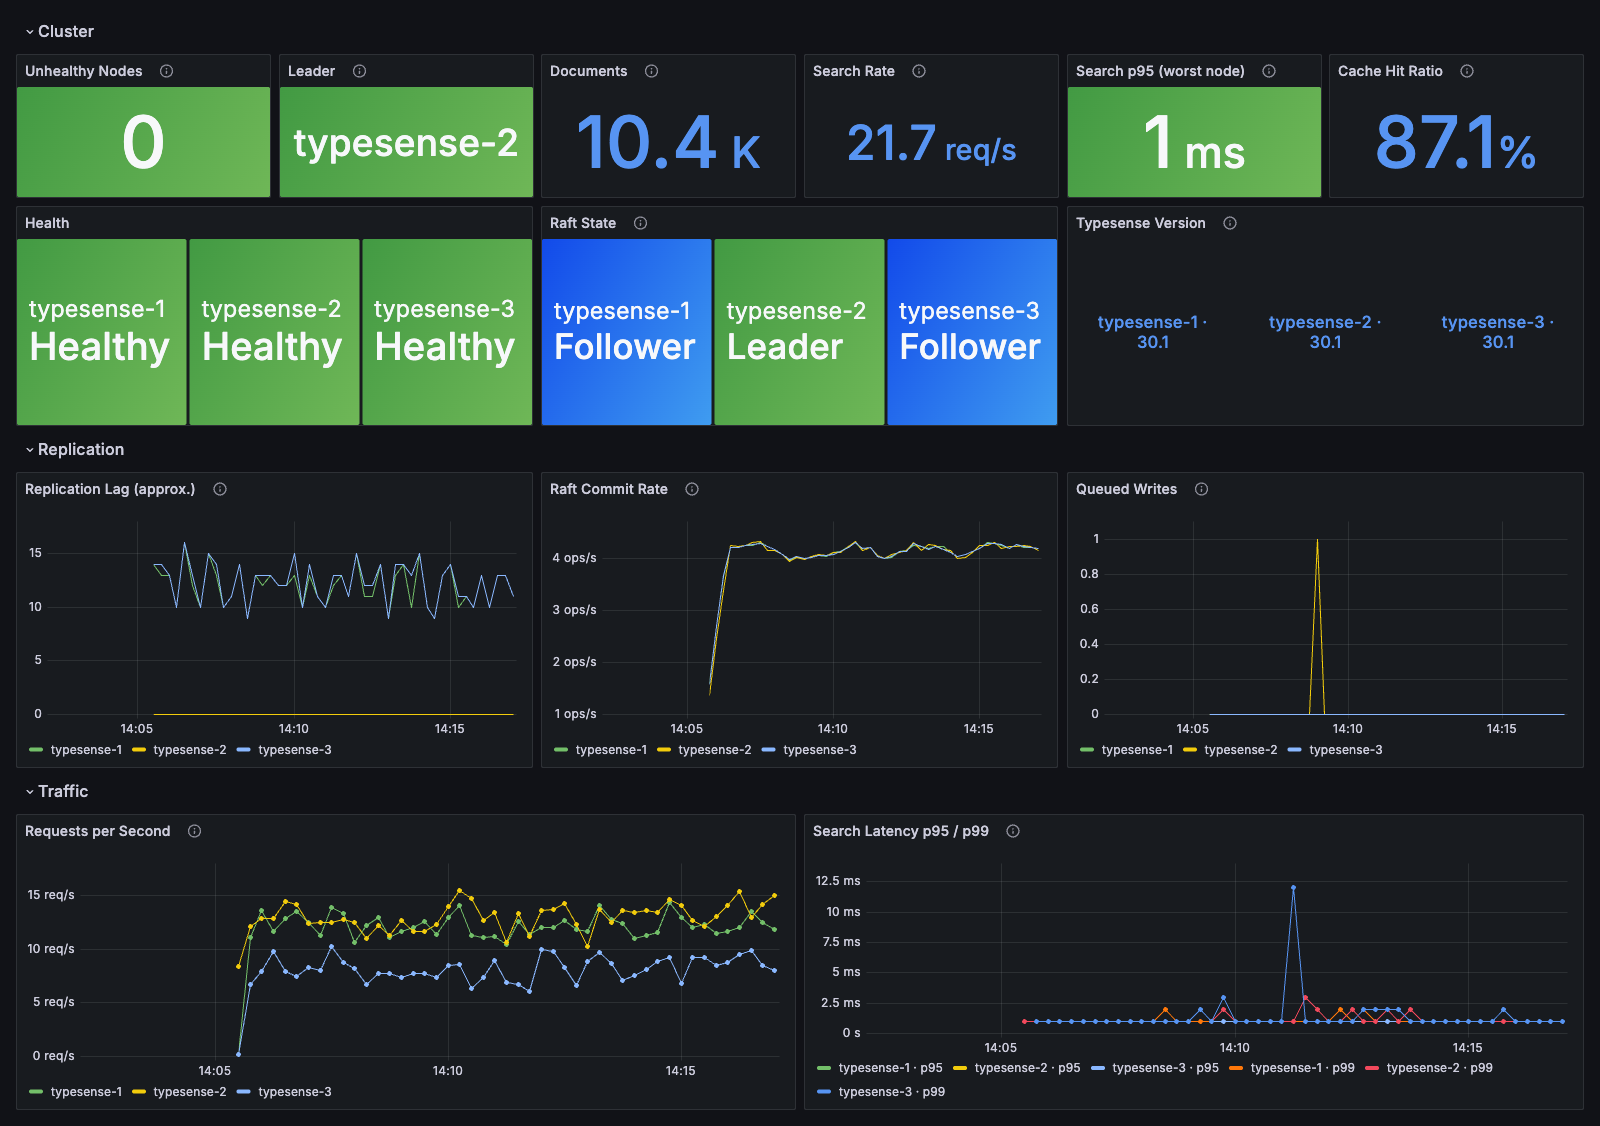
Panels on this dashboard
- Cluster: Unhealthy Nodes, Leader, Documents, Search Rate, Search p95 (worst node), Cache Hit Ratio, Health, Raft State, Typesense Version
- Replication: Replication Lag (approx.), Raft Commit Rate, Queued Writes
- Traffic: Requests per Second, Search Latency p95 / p99
Typesense Metrics#
System resources per node: CPU for every core, memory, swap, disk and network, plus Typesense's own allocator memory and fragmentation.
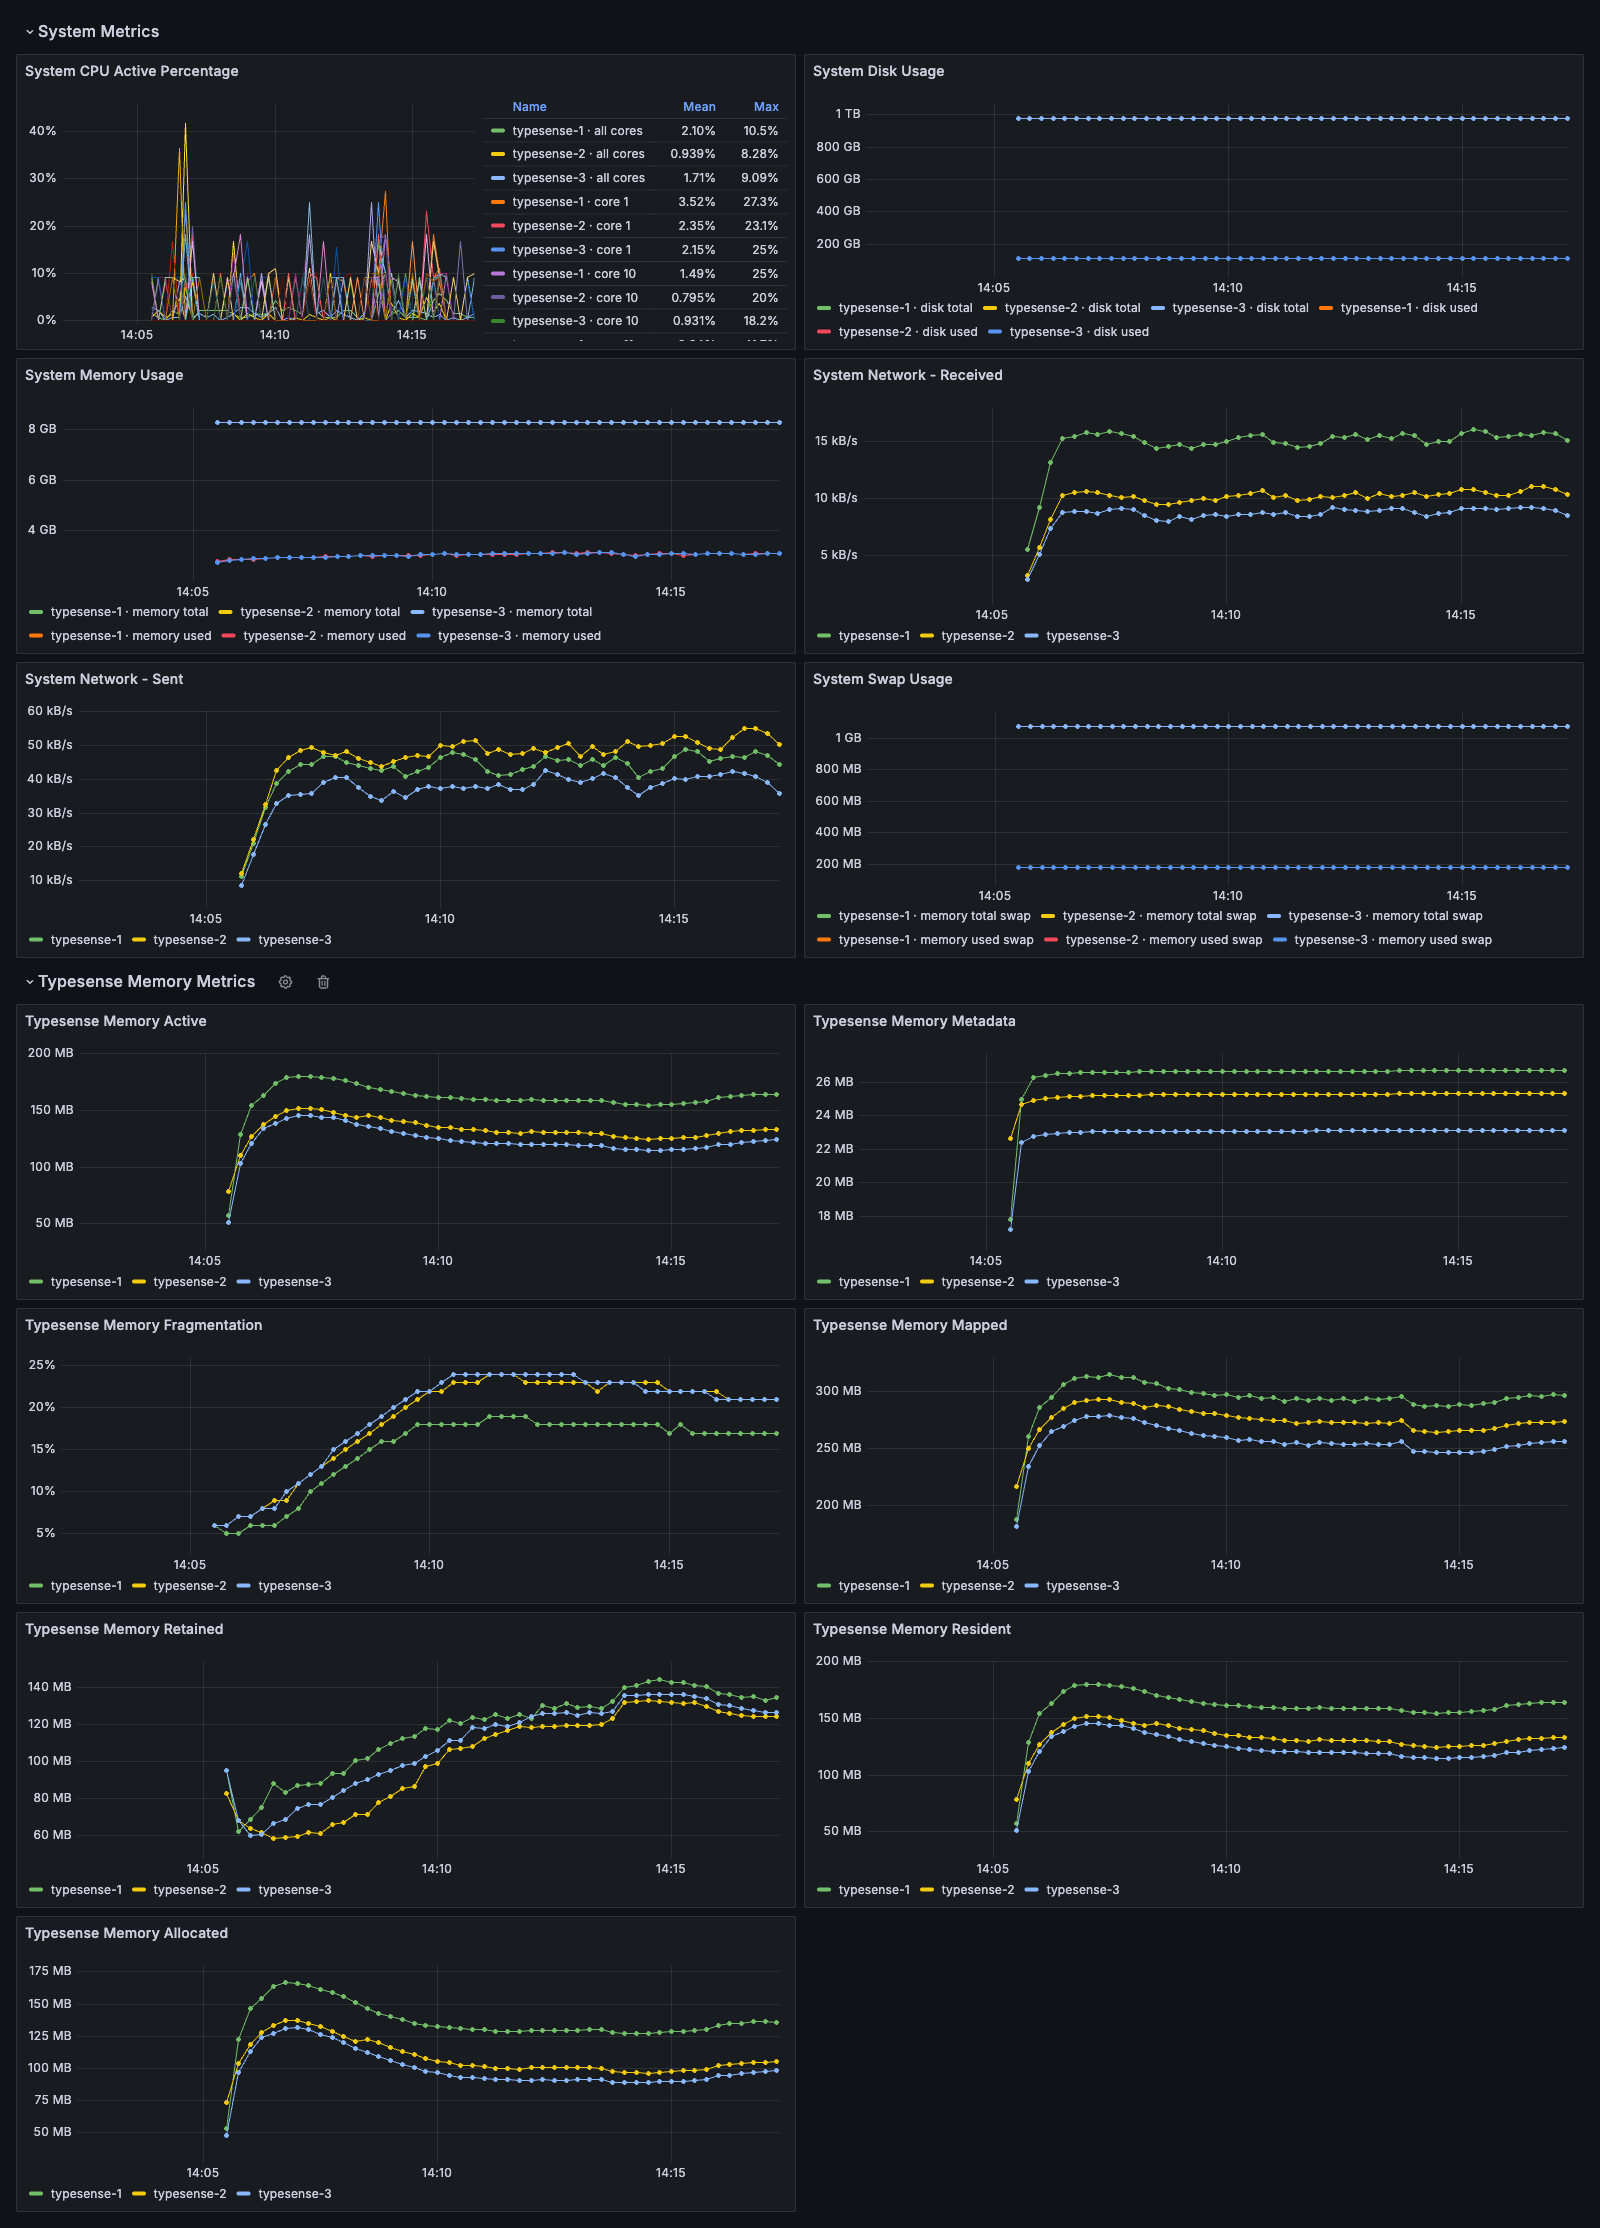
Panels on this dashboard
- System Metrics: System CPU Active Percentage, System Disk Usage, System Memory Usage, System Network - Received, System Network - Sent, System Swap Usage
- Typesense Memory Metrics: Typesense Memory Active, Typesense Memory Metadata, Typesense Memory Fragmentation, Typesense Memory Mapped, Typesense Memory Retained, Typesense Memory Resident, Typesense Memory Allocated
Typesense Stats#
Requests per second and latency for search, write, import and delete, with the average, p95, p99 and max, and the search cache hit ratio.
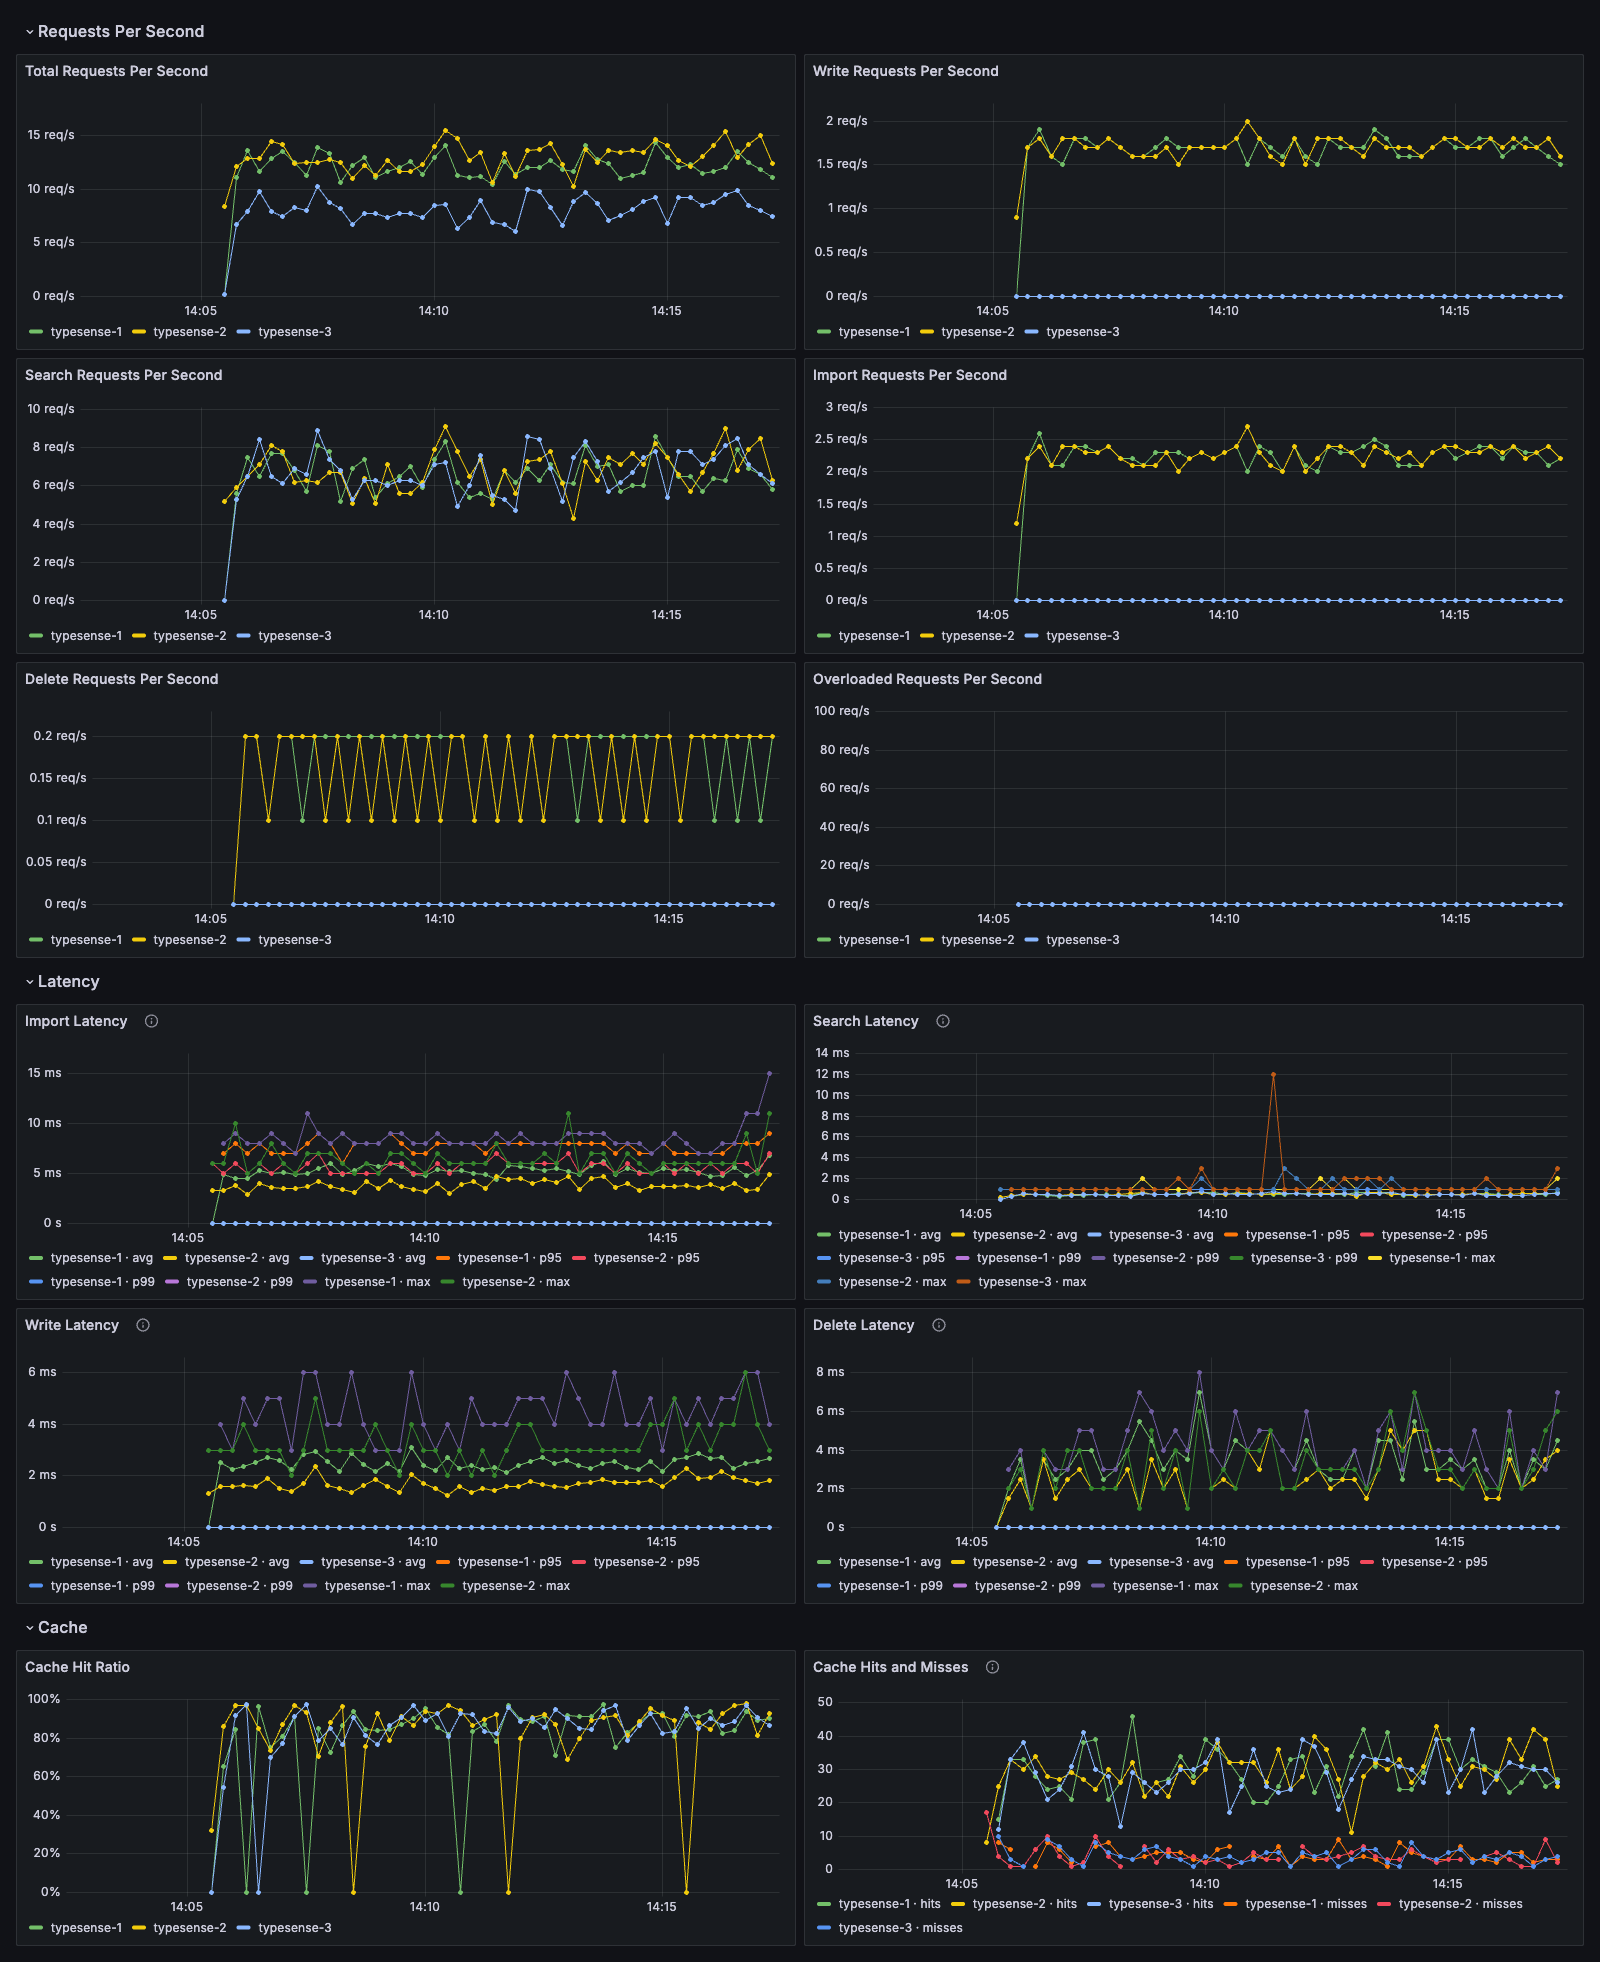
Panels on this dashboard
- Requests Per Second: Total Requests Per Second, Write Requests Per Second, Search Requests Per Second, Import Requests Per Second, Delete Requests Per Second, Overloaded Requests Per Second
- Latency: Import Latency, Search Latency, Write Latency, Delete Latency
- Cache: Cache Hit Ratio, Cache Hits and Misses
Typesense By Collection#
Request rate, latency and document count per collection, to find the collection behind a slowdown.
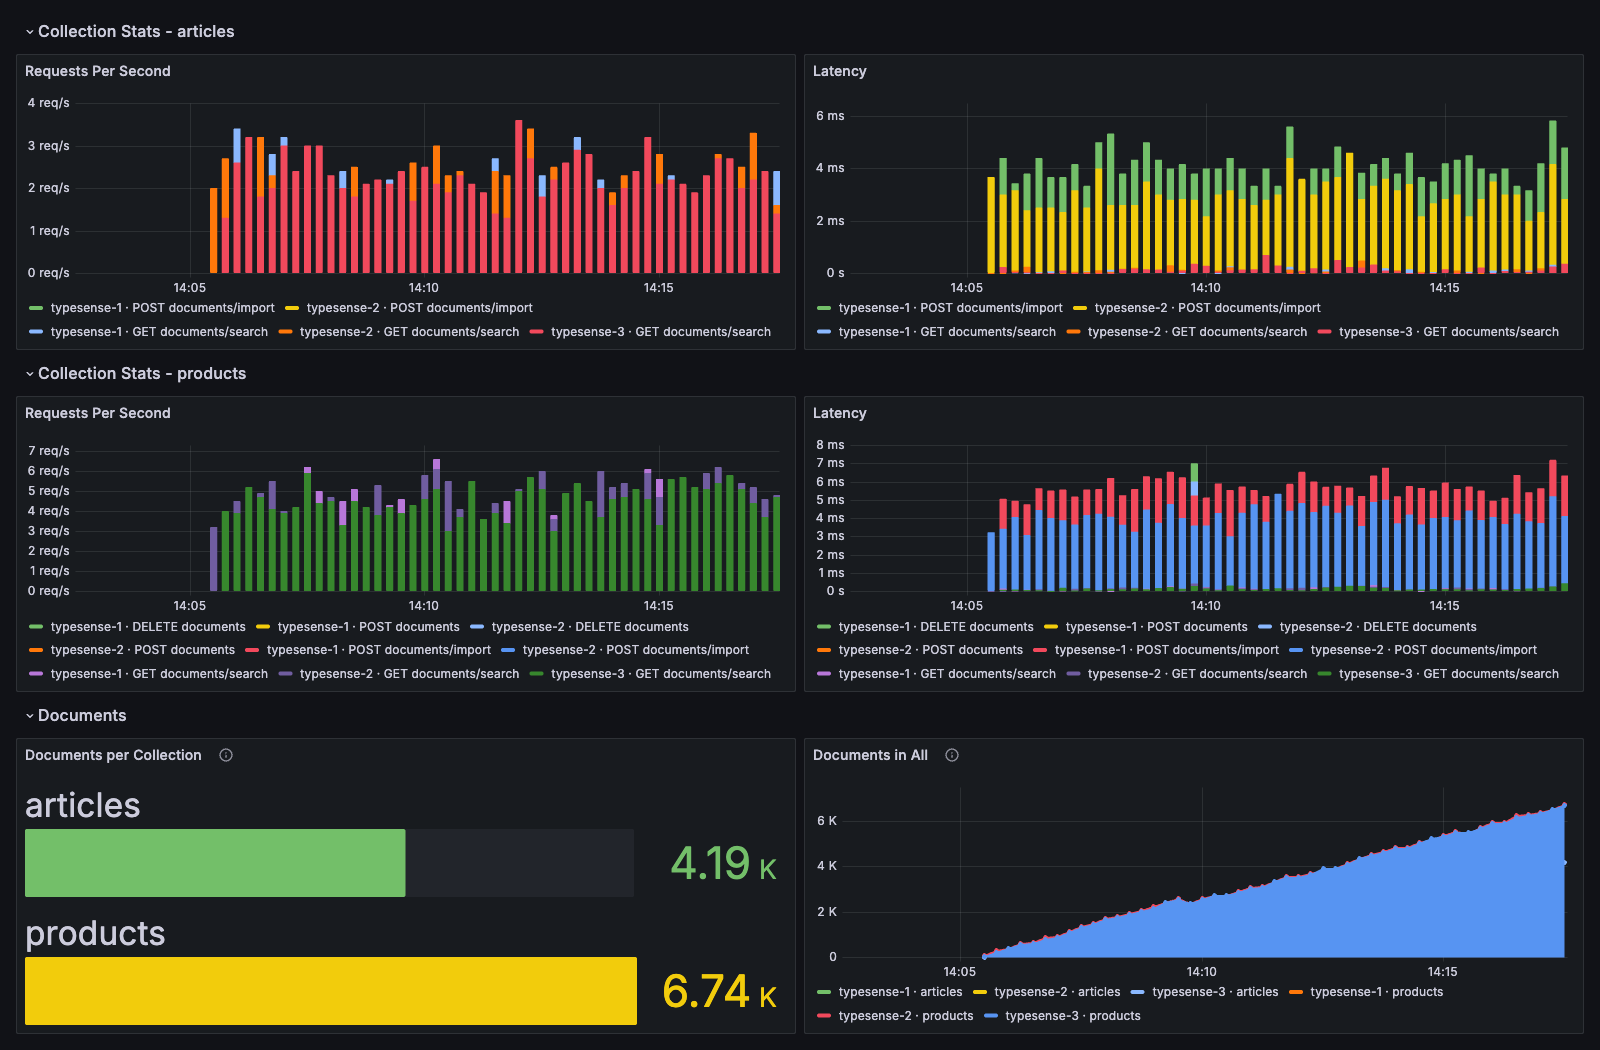
Panels on this dashboard
- Collection Stats - $collection: Requests Per Second, Latency
- Documents: Documents per Collection, Documents in $collection
To install them, see importing the dashboards. To reproduce these screenshots, run the stack from getting started.
This page is generated from README.md on GitHub. Found a mistake? Open an issue.